
O grouping data into ranges is used to get the frequency distribution in continuous datasets or with many observations, even if they are discrete values.
see more
Students from Rio de Janeiro will compete for medals at the Olympics…
The Institute of Mathematics is open for registration for the Olympics…
from data analysis it is possible to extract information and obtain insights for making important decisions, in the academic and corporate environment.
However, raw data say little or nothing about the behavior of a variable, making it necessary to use techniques to organize and summarize the data, such as the frequency distribution.
When we count how many times a value appears in a dataset, we are getting its absolute frequency.
By calculating the frequencies of each of the possible values of a variable, we obtain the frequency distribution.
Dividing the absolute frequency by the total number of observations, we can also obtain the relative frequency.
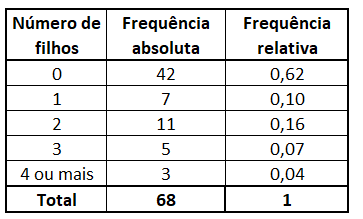
Example:
Frequency distribution of the number of children of a company's employees.
When a data set has many observations or the data are continuous, they must be grouped into intervals and frequencies are obtained for each interval, also called a class.
See steps to get data grouping.
1st step) Define the number of classes.
There is no rule for the number of classes.
However, if many classes are considered, the data will not be summarized, we will have a very large table. On the other hand, if few classes are considered, we will lose information about the data, we will have a very reduced table.
Thus, the ideal is to determine the number of classes based on the nature of the data and the knowledge one has about them.
2nd step) Calculate the range of classes.
To calculate the range of classes, we need the number of classes and the total range.
Being that:
3rd step) Compute class limits.
The classes are formed by the lower limit (Li) and upper limit (Ls) and can be expressed as follows:
Which indicates that the interval contains values greater than or equal to Li and smaller than Ls, that is, it is the interval [Li, Ls).
The first class starts with Li being the smallest data value. To obtain Ls, we add Li to the range of classes.
The other classes are obtained in a similar way, considering Li as the Ls value of the previous class.
Example:
Consider the heights, in cm, of 25 physical education students, in ascending order.
159 160 164 168 169 169 169 170 172 172 173 175 175 175 177 179 180 182 182 184 186 186 188 190 192
Let's consider 5 classes.
First class:
Li = 159 and Ls = 159 + 6.6 = 165.6
Second class:
Li = 165.6 and Ls = 165.6 + 6.6 = 172.2
Third class:
Li = 172.2 and Ls = 172.2 + 6.6 = 178.8
Fourth class:
Li = 178.8 and Ls = 178.8 + 6.6 = 185.4
Fifth class:
Li = 185.4 and Ls = 185.4 + 6.6 = 192
Frequency distribution of the heights of the 25 Physical Education students:
| Height classes (cm) | absolute frequency | relative frequency |
| 3 | 0,12 | |
| 7 | 0,28 | |
| 5 | 0,2 | |
| 5 | 0,2 | |
| 5 | 0,2 | |
| Total | 25 | 1 |
Note: In the last class, the upper limit belongs to the class.
You may also be interested: