Math activity, aimed at students in the third or fourth year of elementary school, with questions about reading and analysis of bar and column graphs.
This math activity is available for download as an editable Word template, ready to print to PDF and also the completed activity.
Download this math exercise from:
SCHOOL: DATE:
PROF: CLASS:
NAME:
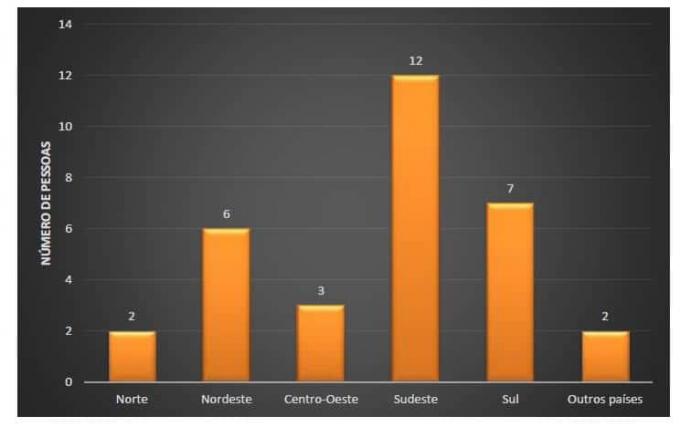
1) The column chart below records the regions where the parents or guardians of Larissa's colleagues were born, note:

a) Write the names of the regions in descending order of the number of people.
A.
b) How many people responded to this survey?
A.
c) In how many regions were the birthplaces grouped?
A.
d) Which region had a predominance of originated people?
A.
2) Analyze the bar chart below and answer the following questions:

a) Is the number of people interviewed in this survey the same as in the previous chart?
A.
b) For how many regions was at least one answer obtained?
A.
c) In this graph, are there mothers from other countries?
A.
3) Collect data about the origin of your parents or guardians. Then, with the help of your teacher, create a column chart in the computer lab. Good research!
By Rosiane Fernandes Silva - Graduated in Literature and Pedagogy - Postgraduate in Special Education.
At answers are in the link above the header.
 report this ad

