In competitive examinations and entrance exams, many questions are presented with graphics and candidates need to be prepared to interpret them and extract the information needed to get the correct answer.
With that in mind, we prepared a chart exercise list, all with resolution and feedback so you can train and get closer to doing well on math tests!
see more
Students from Rio de Janeiro will compete for medals at the Olympics…
The Institute of Mathematics is open for registration for the Olympics…
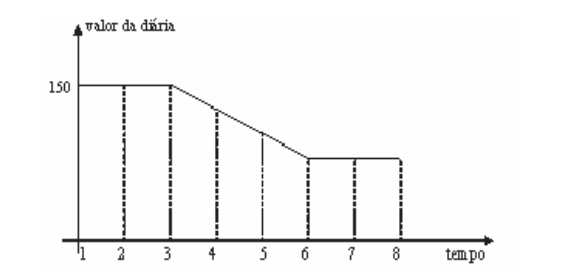
Question 1. (Enem 2009) An inn offers promotional packages to attract couples to stay for up to eight days. The accommodation would be in a luxury apartment and, in the first three days, the daily rate would cost R$ 150.00, the daily price outside the promotion. In the following three days, a reduction in the daily rate would be applied, whose average rate of change, each day, would be R$ 20.00. For the remaining two days, the price of the sixth day would be maintained. Under these conditions, a model for the idealized promotion is shown in the graph below, in which the daily rate is a function of time measured in number of days.

According to the data and the model, comparing the price that a couple would pay for hosting per seven days off the promotion, a couple who purchase the promotional package for eight days will save in:
A) BRL 90.00.
B) BRL 110.00.
C) BRL 130.00.
D) BRL 150.00.
E) BRL 170.00.
Question 2. (Enem 2017) Traffic congestion is a problem that afflicts thousands of Brazilian drivers every day. The graph illustrates the situation, representing, over a defined time interval, the variation in the speed of a vehicle during a traffic jam.

How many minutes did the vehicle remain immobile over the total time interval analyzed?
A) 4.
B) 3.
C) 2.
D) 1.
E) 0.
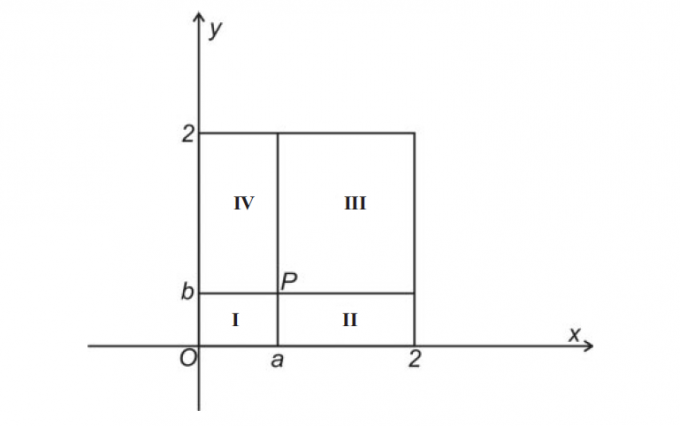
Question 3. (UFMG 2007) Let P = (a, b) be a point in the Cartesian plane such that 0 < a < 1 and 0 < b < 1. The lines parallel to the coordinate axes passing through P divide the square of vertices (0,0), (2,0), (0,2) and (2,2) into regions I, II, III and IV, as shown in this figure:

consider the point . So, it is CORRECT to say that the point
is in the region:
THERE.
B) II.
C) III.
D) IV.
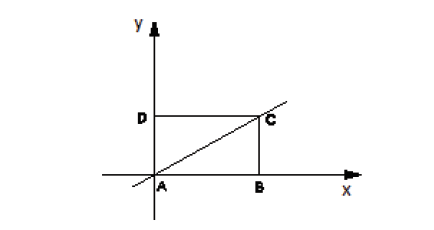
Question 4. (PUC – RIO 2014) Rectangle ABCD has one side on the x axis and one side on the y axis, as shown in the figure. The equation of the line passing through A and through C is , and the length of side AB is 6. The area of triangle ABC is:

A) 10.
B) 11.
C) 24.
D) 12.
E) 6.
Question 5. (Enem 2013) A store monitored the number of buyers of two products, A and B, during the months of January, during the months of January, February and March 2012. With that, you got this graph:
 The store will raffle a gift among buyers of product A and another gift among buyers of product B.
What is the probability that the two lucky winners made their purchases in February 2012?
A)
B)
W)
D)
AND)
Outside the promotion, the daily rate costs R$ 150.00, so a couple staying for 7 days will pay R$ 1050.00, because:
150 × 7 = 1050
A couple staying for 8 days, within the promotion, will pay R$ 960.00, because:
(150 × 3) + 130 + 110 + (90 × 3) = 960
Calculating the difference between 1050 and 960, we see that the couple who purchased the promotional package will save R$90.00.
Correct alternative: a.
Observing the graph, we can notice that the vehicle remained immobile from minute 6 to minute 8, which is when the velocity (vertical axis) is equal to 0.
Therefore, the vehicle remained immobile for 2 minutes.
Correct alternative: C.
The abscissa of point Q is the hypotenuse (c) of the right triangle with legs a and b:
The hypotenuse of a right triangle is always greater than either side, so we have c > a, so the abscissa of the point Q is a value greater than the.
Now, let's see about the ordinate of point Q. We have 0 < a < 1 and 0 < b < 1 and we want to know the range of ab.
If b could be 0 then we would have ab = 0, and if b could be 1 then we would have ab = a and we could conclude that 0 ab
The.
However, we have 0 < b < 1, which implies that 0 < ab < a. Analogously, we have 0 < a < 1, which implies that 0 < ab < b.
Therefore, the ordinate of the point Q is a value less than b. Thus, point Q is in region II of the graph.
Correct alternative: B
We can calculate the area of the triangle from the measure of the base and the height.
We know that the length of side AB is equal to 6, so we already have the length of the base.
It remains for us to calculate the height measurement, which, in this case, corresponds to the ordinate of point C (6,y).
Since C belongs to the line , just substitute x for 6 to find y.
So the height is equal to 4.
Correct alternative: D.
Looking at the graph, we see that 30 people bought Product A in February and that 10 + 30 + 60 = 100 people bought Product A in the entire period.
Thus, for product A, the probability that the winner made the purchase in February is:
Furthermore, we note that 20 people bought product B in February and that 20 + 20 + 80 = 120 people bought product A in the entire period.
Multiplying these two probabilities together, we determine the probability that the two draws bought in February:
Correct alternative: a.
You may also be interested:


