Problem situations in addition and subtraction mathematics, with questions that also address the analysis of tables and graphs, this activity is proposed for students in the fourth year of elementary school.
You can download this math activity in editable Word template, ready to print in PDF as well as the completed activity.
Download this activity from:
SCHOOL: DATE:
PROF: CLASS:
NAME:
1) In December Carlinhos went to a clothing store with his father and bought the following items:
Item |
Value |
shorts |
30,00 |
Sneakers |
110,00 |
Regatta |
55,00 |
Pants |
122,00 |
T-shirt |
45,00 |
Half |
12,00 |
Look at the table and answer:
A) Note the price of the race and the shorts, what is the difference between the prices?
A:
Calculation
B) What was the total spent on this purchase?
A:
Calculation
C) What is the difference between the price of the most expensive product and the cheapest?
A:
Calculation
D) How much did the tank top and pants cost together?
A:
Calculation
E) Carlinhos' father paid for the purchases with 8 bills of 50 reais. How much change is left?
A:
Calculation
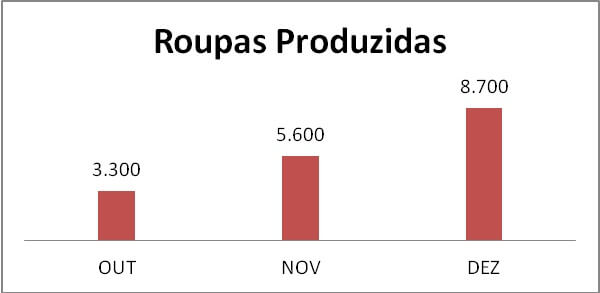
2) The graph below shows the production of clothes, in a factory, in the last quarter of last year. Look at the chart and answer:

A) How many more clothes were produced in November compared to October?
A:
Calculation
B) How many clothes were produced in the quarter represented in the graph?
A:
Calculation
3) Marta's mother lives in a remote place, observe what is necessary to get there. 126 kilometers by car, for 2 hours and 12 minutes. Then, 57 kilometers by boat for 1 hour and 23 minutes.
A) How far does Marta travel to get to her mother's farm?
A:
Calculation
B) How long does it take to get there?
A:
Calculation
For ACCESS
At answers are in the link above the header.
 report this ad

